Joseph S. Renzulli
University of Connecticut
The goal of SEM is to promote high-end learning, and I have tried to spell out what this type of learning is about in the article included in the SEM section of this web site (see The Definition of High End Learning). A brief summary of the essential ingredients of high-end learning is as follows:
The ability:
- to plan a task and consider alternatives
- to monitor one’s understanding and the need for additional information
- to notice patterns, relationships, and discrepancies
- to generate reasonable arguments and explanations
- to draw comparisons and analogies to other problems
- to transform factual information in to usable knowledge
- to fluently access relevant knowledge and selectively extract meaning from information
- to predict outcomes
- to apportion time, money, and resources
- to communicate effectively in different genres and formats
All of the above are directed toward the major purpose of high-end learning, which is:
- to apply knowledge and problem solving strategies to real world problems
Although the goal of SEM is to promote these kinds of learning rather than merely pumping up achievement test scores, we nevertheless receive many requests from interested persons about achievement gains. A few schools using the model have shared test results with us and we are in the process of designing a study that will examine test score data as well the other types of data that reflect our major focus on high-end learning. The first table below (from two schools that prefers to remain anonymous) shows gains in reading, math, and total battery scores, and in two of the three areas, the gains represented statistically significant increases. The control group school, on the other hand, showed statistically significant decreases in all three areas.
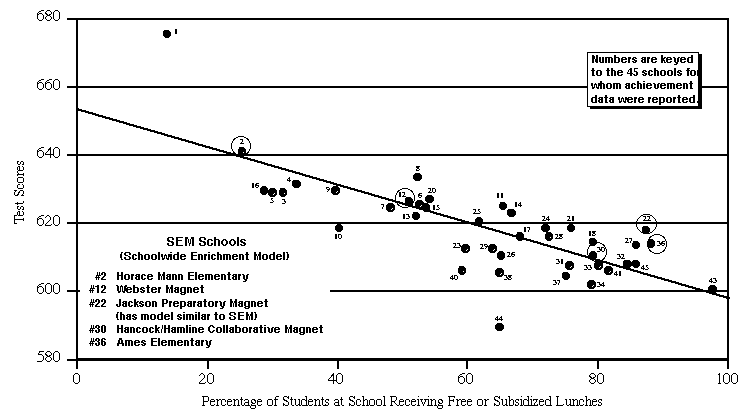
The second item below shows that all of the SEM schools in St. Paul, MN scored above the district mean for their reference group, which was based on the percentage of students receiving free or subsidized lunches. Although these findings are not part of a study that used controlled groups, they nevertheless point out some achievement test advantages for SEM schools. If your school is using SEM, and you have any kind of achievement test data that shows score changes over time or score comparison with demographically equivalent but non-SEM schools, I would be most pleased to hear from you. As these types of data begin to accumulate, we will share them with you at this section of the web site.
Metropolitan Achievement Test 7 NCE Scores of Low Achieving Students
(Title I students in SEM schools vs. equivalent students in non-SEM schools)
**significant decrease
SAINT PAUL PIONEER PRESS
Test Scores: The Poverty Link
St. Paul school test scores linked with poverty levels
A new standardized test was administered last fall to most St. Paul public school students in grades two through 10. The ambitious testing program in intended to give a more through look at students performance. The results show a strong connection between achievement and income levels.
Relationship of poverty to test scores
- This chart shows the relationship of sixth-graders’ scores at each St. Paul elementary school to the percentage of students at that school who are eligible for free or reduced price lunch. The lower the average sixth grade score, the lower the school number appears on the chart; the greater the percentage of students who are low income in the school, the farther to the right the school number appears on the chart.
- The line through the chart, called a regression line, shows a trend of higher levels of poverty associated with lower test scores. The farther from the line that a school number appears, the more important were factors other than income, such as parent involvement, fluency in English and stability of the students enrollment.
- For this comparison, the score is given as a scaled score, a measure St. Paul school officials believe is best for comparison purposes.
